
If you want an AI agent to answer energy questions, plan on four or five energy APIs. The price people pay, the tariff at an address, solar output estimates and weather history all sit in different places.
I asked an agent in Delegate Agents:
I'm thinking about rooftop solar for a house in Denver, Colorado (zip 80203). Using energy data services, tell me: what Colorado homes pay per kWh for electricity now and over the last 12 months, the residential electricity tariff the local utility charges at that zip, how much a 7 kW rooftop array there would produce per year, and how sunny it actually was there day by day in October 2026. For each answer, say which service it came from and what it cost.
Then a wholesale question:
What was the average real-time power price at ERCOT's Houston hub in October 2026, week by week?
Two prompts, seven services, $0.18 in all.
| Service | Best for | Price | What our run returned |
|---|---|---|---|
| US Energy Statistics (EIA) | State electricity prices over time | $0.00 | 12 months of Colorado home prices, 15.97 to 17.17 cents |
| US Utility Electricity Tariffs by Address (OpenEI via Tume AI) | Utility rate schedules at an address | $0.04 | 5 residential schedules from the local utility |
| Solar PV Output Estimate (NREL PVWatts) | Solar output estimates | $0.00 | 11,165 kWh a year from 7 kW |
| NASA POWER Daily Point Data | Daily solar and weather history | $0.00 | 31 days of October solar energy |
| Energy Market SQL Query (Tume AI) | Wholesale prices, load and storage in US power markets | $0.04 a query | ERCOT Houston hub prices for October, by week |
By hand
- Find the state price table at EIA
- Find the utility's rate book
- Run PVWatts in the browser
- Download NASA POWER data
- Put it together yourself
- five sites, five formats
With an agent
- Ask the question
- Answer with sources
- about 3 minutes, $0.064
It asked me for a street address, because the tariff service needs one, and I gave it the Colorado State Capitol, 200 E Colfax Ave. About three minutes later it had used five services for $0.06376, $0.02376 of it for turning the zip code into coordinates. The wholesale question, together with a monthly split of the solar estimate, cost $0.12.
1. US Energy Statistics (EIA)
Best for: state-level electricity, oil, gas and coal statistics over time. Price: free.
It returned 12 months of average residential prices for Colorado, September 2025 to August 2026, with sales, revenue and customer counts for each month. Prices ran from 15.97 cents a kWh in December 2025 to 17.17 cents in August 2026.
The limit is time. When I ran it, the newest month was August, and the agent said so rather than call 17.17 cents today's price. These are statewide averages, too, not what your house pays.
Verdict: start here for state prices and how they changed. It's free.
2. US Utility Electricity Tariffs by Address (OpenEI via Tume AI)
Best for: the rate schedules a utility charges at a street address. Price: $0.04.
From 200 E Colfax Ave it found Public Service Co of Colorado, Xcel Energy's Colorado utility, and five residential schedules effective January 1, 2026. The standard one, Schedule R, charges 15.568 cents a kWh from October to May, 17.288 cents from June to September, and $8.19 a month. On the time-of-use schedule, power from 5 to 9 p.m. on weekdays costs 32.832 cents in winter and 38.109 cents in summer.
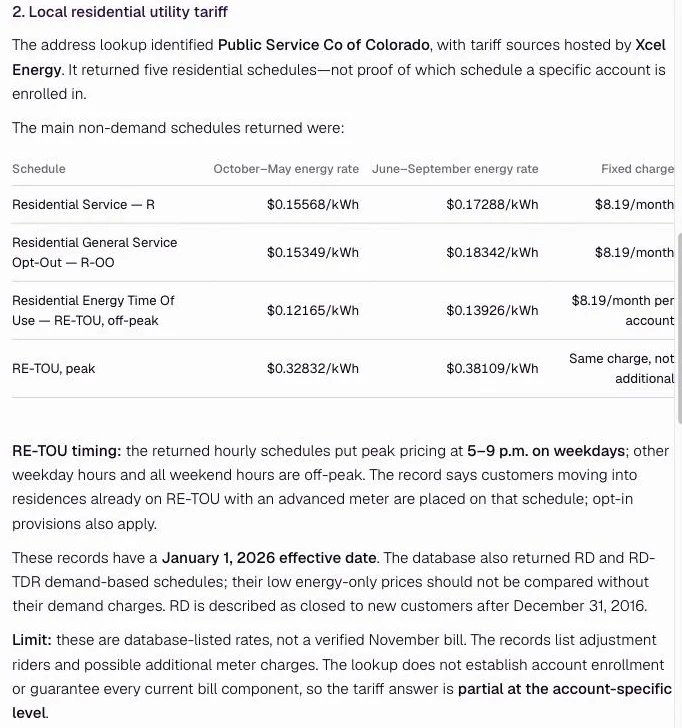
It needs a street address. A zip code isn't enough. And it can't know which schedule a given account is on, or add up riders and meter charges, so the agent called its answer "partial at the account-specific level." I checked Schedule R on the OpenEI rate page, and it matches.
Verdict: the only one of the five with the rate at an address. Use it for any question about a bill.
3. Solar PV Output Estimate (NREL PVWatts)
Best for: how much a solar array of a given size, tilt and direction produces in a typical year. Price: free.
For 7 kW of standard panels on a fixed roof mount, 20 degrees, facing south, with 14% losses, it estimated 11,165 kWh a year, a capacity factor of 18.21%. For the second prompt the agent split that by month, from 12.91% in December to 22.16% in June. It didn't buy anything new for that. It reused the result it already had from the first chat, for free.
PVWatts uses typical-year weather, so it won't tell you what 2026 produced, and it knows nothing about the tree next door. The agent picked the tilt and losses itself and listed them, so change them in the prompt if you know your roof.
Verdict: the usual first estimate for solar output. It's free and lists its assumptions.
4. NASA POWER Daily Point Data
Best for: daily solar and weather values for any point, for any past date range. Price: free.
It returned the solar energy that reached the ground for every day of October 2026 at the Denver coordinates. October 2 was the brightest at 5.45 kWh per square meter. October 15 was the darkest at 1.15, after 1.40 the day before. I also wanted the clear-sky series to compare against, but 17 of its 31 days were missing, and the agent left them out instead of filling them in.
These are satellite and model estimates for a grid cell, not a sensor on the roof, and the days follow solar time, not Denver's clock.
Verdict: use it for daily solar and weather history anywhere. It's free.
5. Energy Market SQL Query (Tume AI)
Best for: prices, load and storage revenue from US power markets, queried in SQL. Price: $0.04 a query, plus $0.04 for each look at the dataset catalog.
The agent first read the catalog twice to find the right ERCOT table and its filters. (I couldn't have named that table myself.) Then it ran a query over 2,976 fifteen-minute prices for the Houston hub in October 2026.
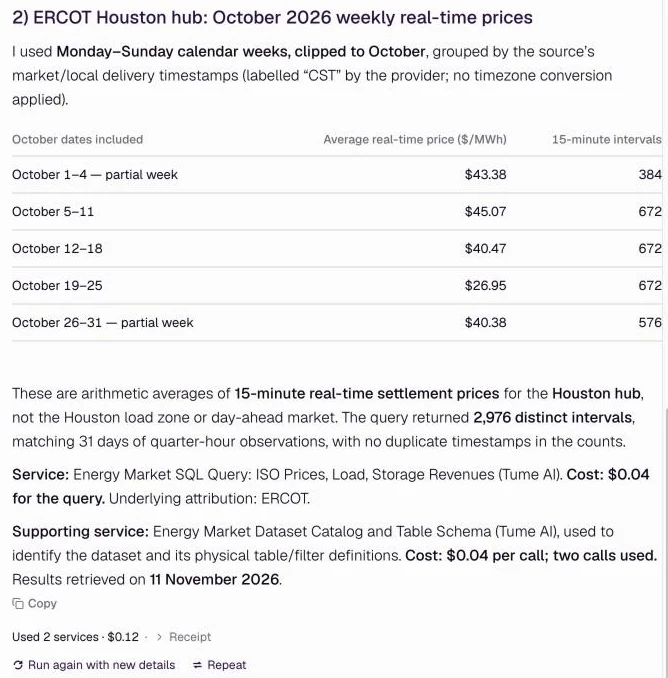
It labeled exactly what it measured: hub prices, real-time, not the Houston load zone and not day-ahead. Two-thirds of the $0.12 went on finding the table, so a second question on the same market would cost less.
Verdict: the one to use for wholesale markets.
- services used
- 7
- for the rooftop question
- about 3 min
- ERCOT prices averaged
- 2,976
- for both prompts
- $0.18
Also in the catalog
I didn't run these, but they're live today, with prices from the catalog:
- Hourly Solar or Wind Capacity-Factor Profile for a Site (Tume AI), $0.04. For hour-by-hour profiles instead of PVWatts' monthly ones.
- Natural Gas and Power Forward Curves from Monthly Market Reports (Tume AI), $0.04.
- FERC eLibrary Docket Filings Search (Tume AI), $0.04.
- EV Charging Stations Near a Location (NREL), free.
Questions people ask
Do I need an API key for each?
No. The agent calls them through Delegate and pays per call from your Delegate balance. The free ones cost nothing.
Can it answer for my own house?
Give it your street address and roof details in the prompt. It will still tell you that the tariff can't confirm which schedule your account is on.
Which one should I start with?
EIA and PVWatts, both free. Add the tariff lookup when the question is about a bill, and the market query when it's about wholesale prices.
Open Delegate Agents and ask about your own roof. What energy question would you hand an agent first?
Sources
- U.S. Energy Information Administration, Open Data documentation.
- OpenEI Utility Rate Database, Residential Service (Schedule R), Public Service Co of Colorado.
- PVWatts V8 API documentation.
- NASA POWER.